Unveiling the Best Indicators for Day Trading: Your Ultimate Guide

Business
Day trading is a dynamic and fast-paced approach to trading financial markets, where traders aim to capitalize on short-term price movements within a single trading day. In this intense environment, having the right set of indicators can significantly enhance your ability to identify trading opportunities and make timely decisions. In this comprehensive guide, we’ll explore some of the best indicators for day trading, empowering you with the knowledge to navigate the markets with confidence.
Understanding the Role of Indicators in Day Trading
Indicators are essential tools for day traders, providing valuable insights into market trends, momentum, volatility, and potential reversal points. However, it’s crucial to remember that no single indicator can guarantee success in day trading. Instead, successful day traders often use a combination of indicators to confirm signals and validate trading decisions. With that said, let’s delve into some of the best indicators commonly used by day traders.
Moving Averages
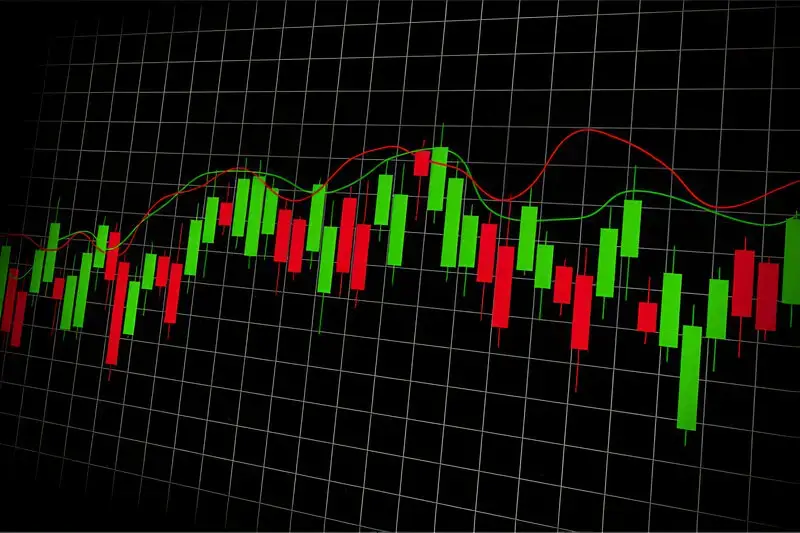
Moving averages are among the most popular and versatile indicators for day trading. They smooth out price data to create a single trend-following line, helping traders identify the direction of the trend and potential entry or exit points. The Simple Moving Average (SMA) and Exponential Moving Average (EMA) are two often used moving averages.Day traders often use a combination of short-term (e.g., 9-period or 20-period) and long-term (e.g., 50-period or 200-period) moving averages to identify short-term trends within the context of the overall market direction.
Relative Strength Index (RSI)
The Relative Strength Index (RSI) is a momentum oscillator that monitors the rate and magnitude of price fluctuations. It oscillates between 0 and 100 and is typically used to identify overbought and oversold conditions in the market. Day traders often use the RSI to confirm trend reversals or to anticipate potential price corrections. A number above 70 indicates overbought situations, while a reading below 30 implies oversold conditions.However, it’s essential to use the RSI in conjunction with other indicators to avoid false signals.
Stochastic Oscillator
Another well-liked momentum indicator that day traders employ to spot possible trend reversals or overbought/oversold circumstances is the Stochastic Oscillator. It is made up of two oscillating lines, %K and %D, that range from 0 to 100. values above 80 denote overbought situations, while values below 20 denote oversold conditions, much like the RSI. above 80 indicate overbought conditions, while readings below 20 suggest oversold conditions. Day traders often look for divergences between price and the Stochastic Oscillator, as well as for bullish or bearish crossovers of the %K and %D lines, to identify potential entry or exit points.
Volume
Volume is a crucial indicator for day traders, as it provides valuable information about the strength and validity of price movements. High volume typically accompanies strong price moves, indicating active participation from traders and investors. Day traders often look for volume spikes or unusual volume patterns that may signal the beginning or continuation of a trend. Additionally, volume can be used to confirm the validity of chart patterns or trading signals generated by other indicators.
Bollinger Bands
Bollinger Bands are volatility bands that consist of a simple moving average (usually 20 periods) and two standard deviation bands above and below the moving average. They dynamically adjust to changes in price volatility, expanding during periods of high volatility and contracting during periods of low volatility. Day traders often use Bollinger Bands to identify potential reversal points or to gauge the strength of a trend. Bollinger Band squeezes, where the bands contract tightly, often precede explosive price movements, providing valuable opportunities for day traders.
MACD (Moving Average Convergence Divergence)
The Moving Average Convergence Divergence (MACD) is a trend-following momentum indicator that consists of two lines: the MACD line and the signal line. Additionally, the MACD histogram represents the difference between the MACD line and the signal line. Day traders often use the MACD to identify trend direction, momentum shifts, and potential entry or exit points. Bullish or bearish crossovers of the MACD line and the signal line, as well as divergences between price and the MACD histogram, can provide valuable trading signals.
Choosing the Best Indicators
Choosing the best indicators for day trading requires careful consideration of your trading style, preferences, and market conditions. While the indicators mentioned in this guide are among the most popular and widely used by day traders, it’s essential to remember that no single indicator can guarantee success.
Instead, focus on understanding the strengths and limitations of each indicator, and consider combining multiple indicators to confirm signals and validate trading decisions. With practice, experience, and a sound trading strategy, you can harness the power of indicators to navigate the fast-paced world of day trading with confidence.
Read Also


